As the climate impact of food becomes clearer, consumers are considering how they can alter their diets. The food we eat is responsible for one-third of global greenhouse gas emissions — but what is the actual carbon cost of your weekly shop?
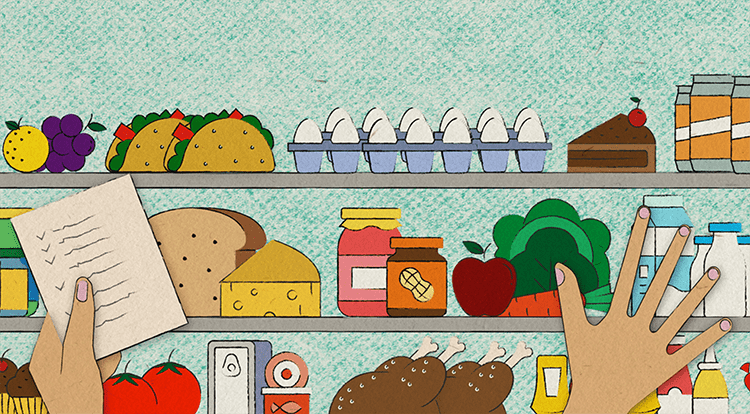
Weigh your favourite items
The climate footprint measures how much greenhouse gas emissions result from producing, transporting and packaging a given food item.
Different greenhouse gases are converted into one common unit. This unit is called kilograms of carbon dioxide equivalent.
You can view a food item’s climate footprint per kilogram or per portion. Some foods (eg meat or vegetables) are typically consumed in larger portions than others (eg cheese, oils or spreads).
| - | Agriculture | - |
| - | Food processing | - |
| - | Transport | - |
| - | Packaging | - |
| - | Other | - |
| Origin | ||
| - | - | |
“People are much more attentive to food now,” says Robin May, chief scientific adviser for the UK’s Food Standards Agency. “We know that a very significant portion of the population has shifted their diet, or tried to shift their diet in the last 12 to 18 months in order to become more sustainable.” Consumers, he says, have a right to “honest, transparent labelling of food”.
This is where carbon labelling comes in. A 2020 survey for the net zero emissions advocacy group Carbon Trust found that the majority of consumers in the UK, US and various European countries supported the idea of carbon labels on food items.
Denmark has announced it will spend DKr9mn ($1.3mn) to develop carbon labelling proposals by the end of the year, becoming one of the first nations to do so. Oat milk company Oatly has carbon labels on its products, while plant-based food group Quorn started to put carbon data on some of its products in 2020 and is aiming to do so for the rest by the end of this year.
Access to reliable data is crucial, as the public’s gut feeling is “absolutely terrible” when it comes to judging which steps of food production created the most emissions, says David Bryngelsson, chief executive of CarbonCloud, a climate change research company that calculates the environmental impact of food.
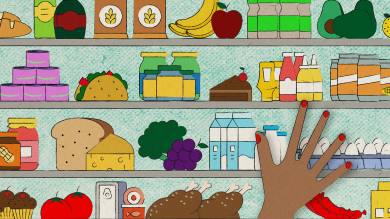
As food companies, retailers and environmental groups work on carbon labelling schemes, the Financial Times has created an interactive tool to help you calculate the greenhouse gas emissions of your groceries so that you can understand the carbon cost of what you eat.
The scales use data from CarbonCloud to show the climate footprint of each item, from farm to aisle. On top of the calculation for the production process, the figures capture the emissions from transporting the item from a typical country of origin to a UK supermarket. The footprint includes all greenhouse gases, from carbon dioxide to methane and nitrous oxide, that play a significant role in the food industry.
Meat, fish and alternatives
The single most emission-intensive item in our digital supermarket is beef fillet steak.
Multiple studies have shown that producing a kilogram of animal protein requires significantly more land, energy and water than producing the same weight in plant protein. Emissions at the farm stage typically dwarf those from processes later in the supply chain, such as transport and packaging.
“Most [greenhouse gas] emissions occur in agriculture, either due to ruminant animals burping methane or due to the use of fertilisers,” says Adisa Azapagic, an expert in environmental systems analysis at the University of Manchester.
“The most important change we can make to reduce the carbon footprint of our diet is to eat less meat,” says Hannah Ritchie, head of research at the University of Oxford’s Our World in Data, a scientific online publication. Eating less red meat, specifically beef and lamb, was particularly effective as these animals produce large amounts of methane, a short-lived but extremely potent greenhouse gas.
There is some debate about the differing impact of grass-fed beef and grain or soya-fed beef. Proponents of the former argue that it minimises the environmental harm from producing the animals’ feed. They also say responsibly managed pastureland cuts the need for inputs such as fertiliser in the chain and acts as a carbon sink. Advocates for grain-fed beef counter that these animals reach slaughter-weight more quickly and therefore release less methane into the atmosphere over their lifespans.
A 2018 study found that wild-caught fishing resulted in fewer emissions than beef or lamb on average, although there were large variations between regions of the world, as well as between different species of fish.
Crustacean fisheries, such as those catching prawns and lobster, were found to use the most fuel and generate the most emissions relative to the size of their catch. Per kilo, frozen prawns are responsible for around three times the emissions of pork chops.
Industrial fishing also causes other issues. Roughly one-third of the world’s fish stocks are overexploited and in decline. The climate footprint of farmed fish is highly variable too — the species of fish, production of the feed and location of the farm all play a role. Another concern is farms polluting coastal areas with excess nutrients from fish faeces and uneaten feed, which can lead to oxygen depletion and destruction of local ecosystems.
Dairy and alternatives
In the dairy aisle, substantial greenhouse gas savings can be made by replacing cow’s milk with a plant-based alternative. Rice, oat and soya drinks all generate less than half the emissions of milk.
Ritchie says it is a common misconception that food products for human consumption made from soya, such as tofu or milk, are among the causes of Amazon deforestation.
“It’s true that soya [production] is linked with deforestation across South America, but the vast majority of the world’s soya is fed to livestock”, she says.
The US Department of Agriculture estimates that 75 per cent of the world’s soya output is used as feed for animals. As demand for meat has grown, so has the rate of destruction of the Amazon rainforest and savannas. Some brands of soya milk are now certified to show that they have no deforestation links.
Almond milk, which is not included in CarbonCloud’s dataset, was found to carry a relatively modest carbon footprint in other studies. The major drawback is that almonds require large amounts of water for irrigation — 370 litres to produce 1 litre of almond milk, according to one analysis.
Cheese products have a high climate footprint, although they tend to be eaten in smaller portions than meat. It takes about 10 litres of milk to make 1kg of cheese and the resulting emissions can be three times higher than those required to produce 1kg of chicken or pork.
Taste and texture differences aside, a plant-based cheese substitute generates between one-third and one-fifth of the emissions of a cheese made from cow’s milk. Butter also weighs heavily on our scales. Producing 1kg of the traditional cow’s milk variety creates more than four times the emissions of chicken thighs or breasts.
Fruit and vegetables
As we move into the fruit and vegetables aisle, the stakes become lower. While there is a lot of variation between products, they are all significantly more climate-friendly than meat or dairy products.
This is true even for items transported halfway around the world, such as bananas from South America. “People often think ‘eat locally’ is the most important thing they can do . . . [but] transport accounts for only a small percentage of food’s emissions,” says Ritchie.
That is because many of the foods people assume travel by air are actually transported by ship, which is a more efficient form of transportation despite still being predominantly powered by fossil fuels. According to one analysis in the journal Science, less than 1 per cent of food miles come from air travel.
Avocados imported from tropical regions — often perceived as a symbol of western consumers’ increasingly unsustainable food preferences — are only modestly more costly in emissions terms than most fruits and vegetables grown in the UK. However, there are environmental concerns about high water and land use.
Azapagic says one factor that can drive up the climate footprint of certain vegetables is cultivation in heated greenhouses. Tomatoes sold in British supermarkets are often grown this way for part of the year, whereas carrots can be grown in the UK’s natural climate all year round. According to CarbonCloud’s data, the climate footprint of tomatoes is almost seven times as high as that of carrots.
Snacks and drinks
What is the climate impact of our guilty pleasures? The same general rule applies as in previous categories: dairy-based products such as milk chocolate or ice cream tend to have larger footprints than those made from plants and cereals.
A study by the University of Manchester shows that chocolate is among the least environmentally sustainable products because of factors such as deforestation and emissions from raw materials, including dairy. Energy use and packaging also raise sustainability issues.
All data provided by CarbonCloud. The figures represent benchmark averages rather than specific brands or products.
Each product’s climate footprint includes greenhouse gas emissions generated from producing the food as well as packaging, transport and storage. The modelling assumes that the consumer is based in the UK.
The portion sizes are based on suggestions from the Association of UK Dietitians and additional FT research for specific food items not included in their list.
The numbers include emissions of carbon dioxide as well as methane and nitrous oxide, which play a significant role in the food industry. All greenhouse gases are converted into a comparable unit — carbon dioxide equivalents — based on their global warming potential, which is a measure of their effect on the climate.
Where one production process results in multiple products, such as different cuts of meat from the same cow, a larger share of the emissions has been assigned to the more expensive products. This is referred to as “economic allocation”.
Illustrations by Carolina Vargas