
For the past nine months, Beijing residents have experienced a rare treat — sparkling blue skies, clouds with clear edges and bright sunsets.
Clear weather does not normally make for news but it does in the Chinese capital, which over the past two decades has been notorious for pollution. Beijing’s off-the-chart pollution days even inspired new words, such as “smogocalypse”, words that now appear to be a thing of the past.
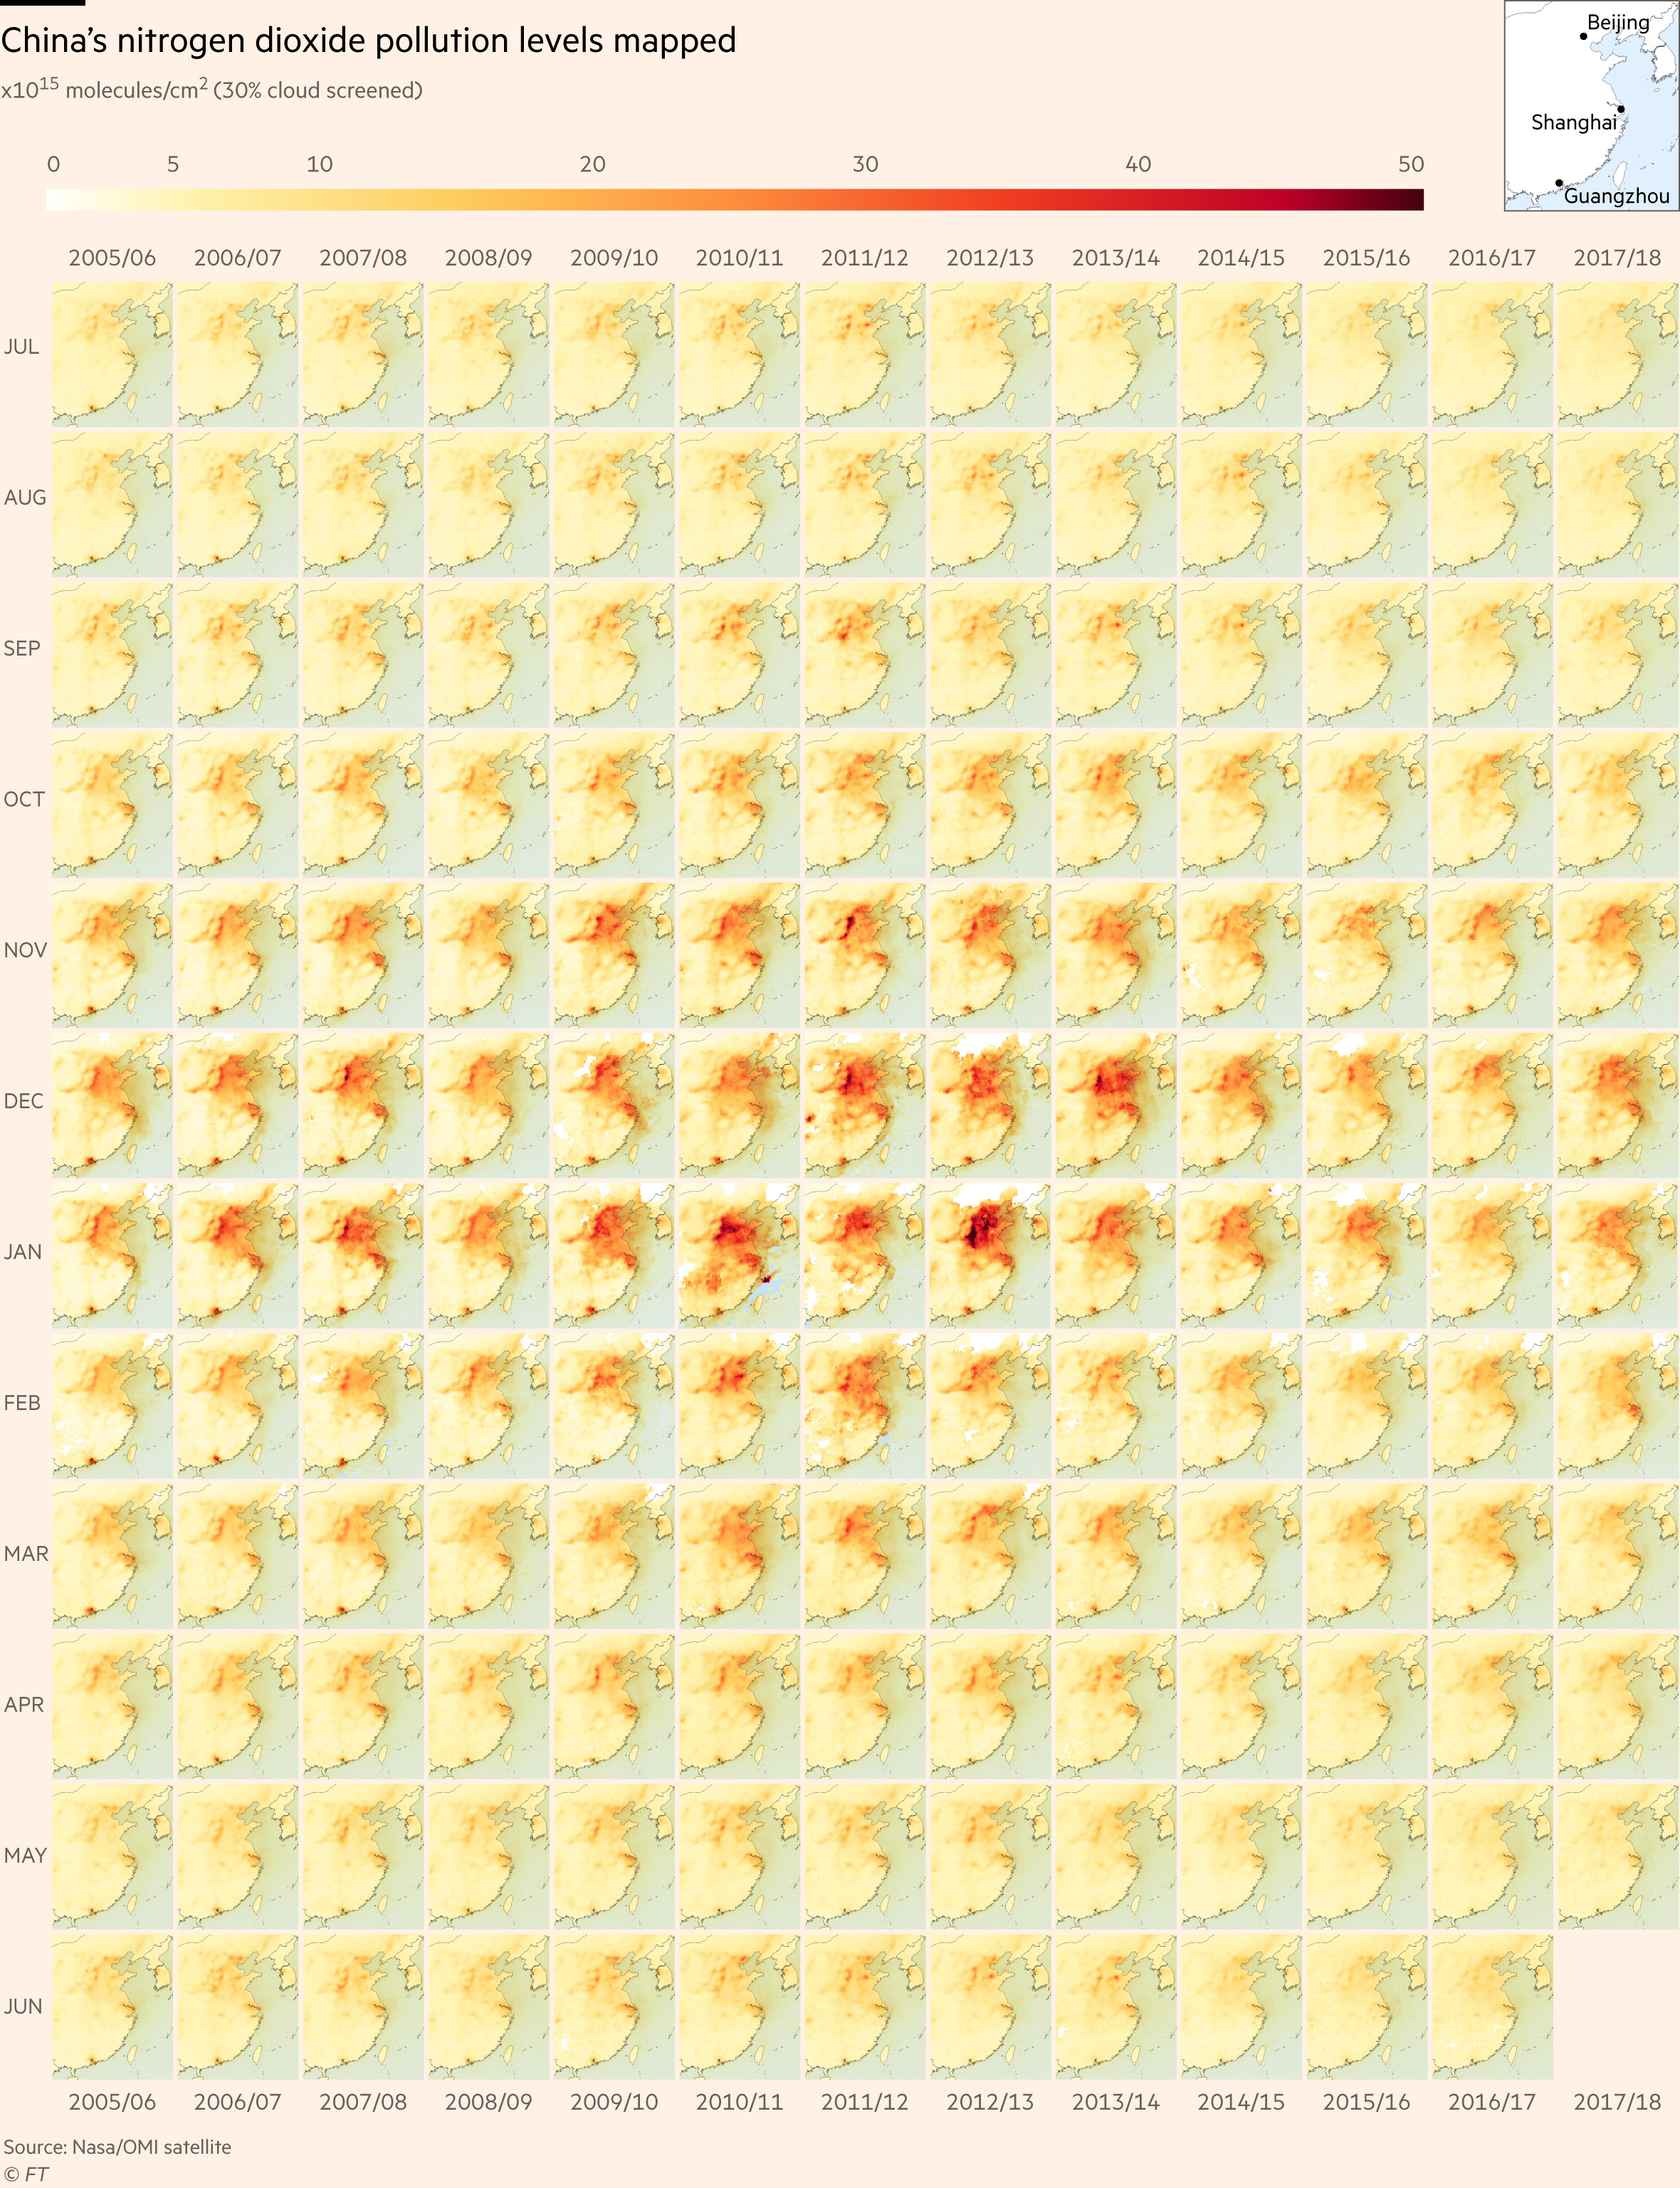
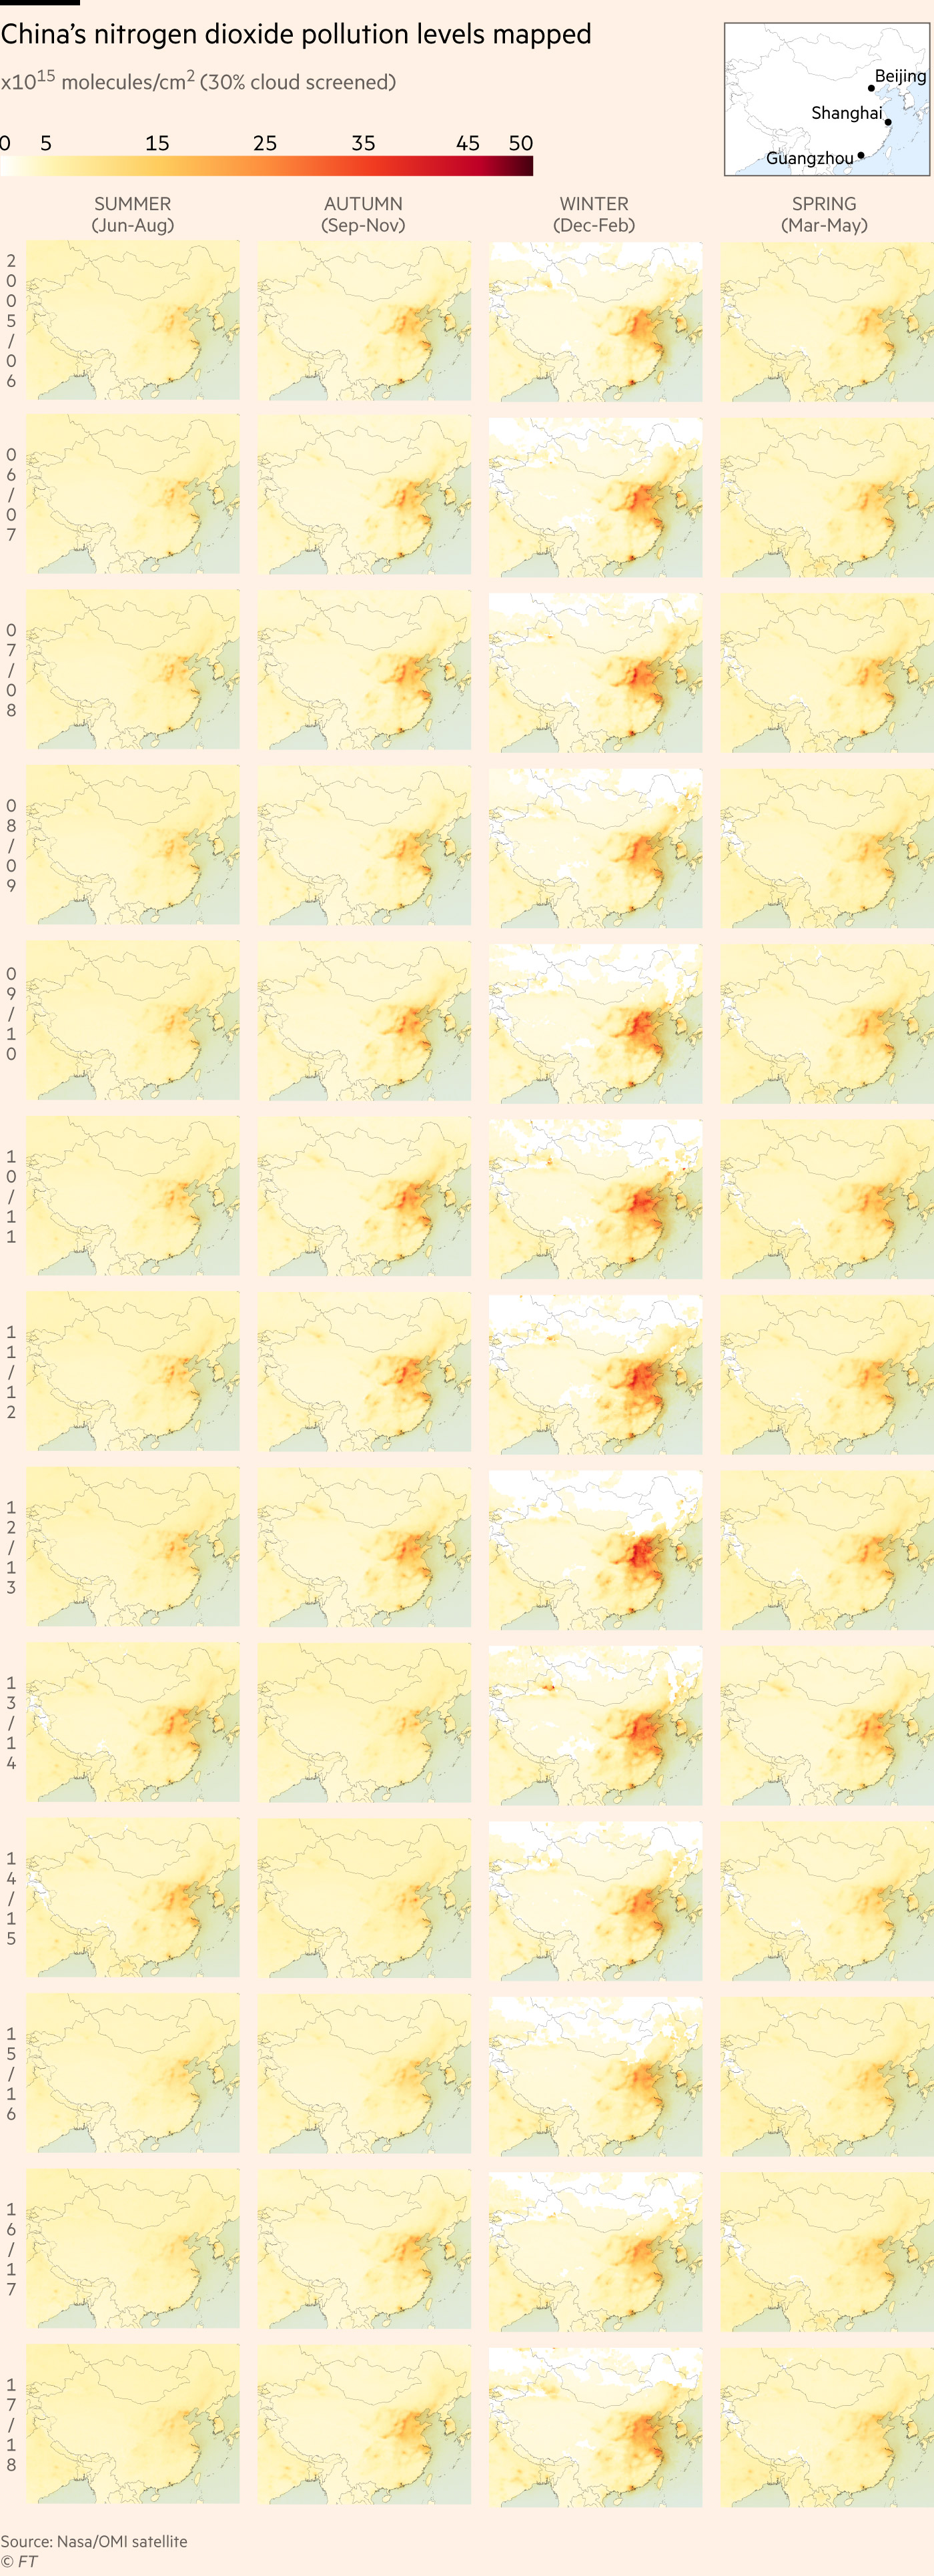
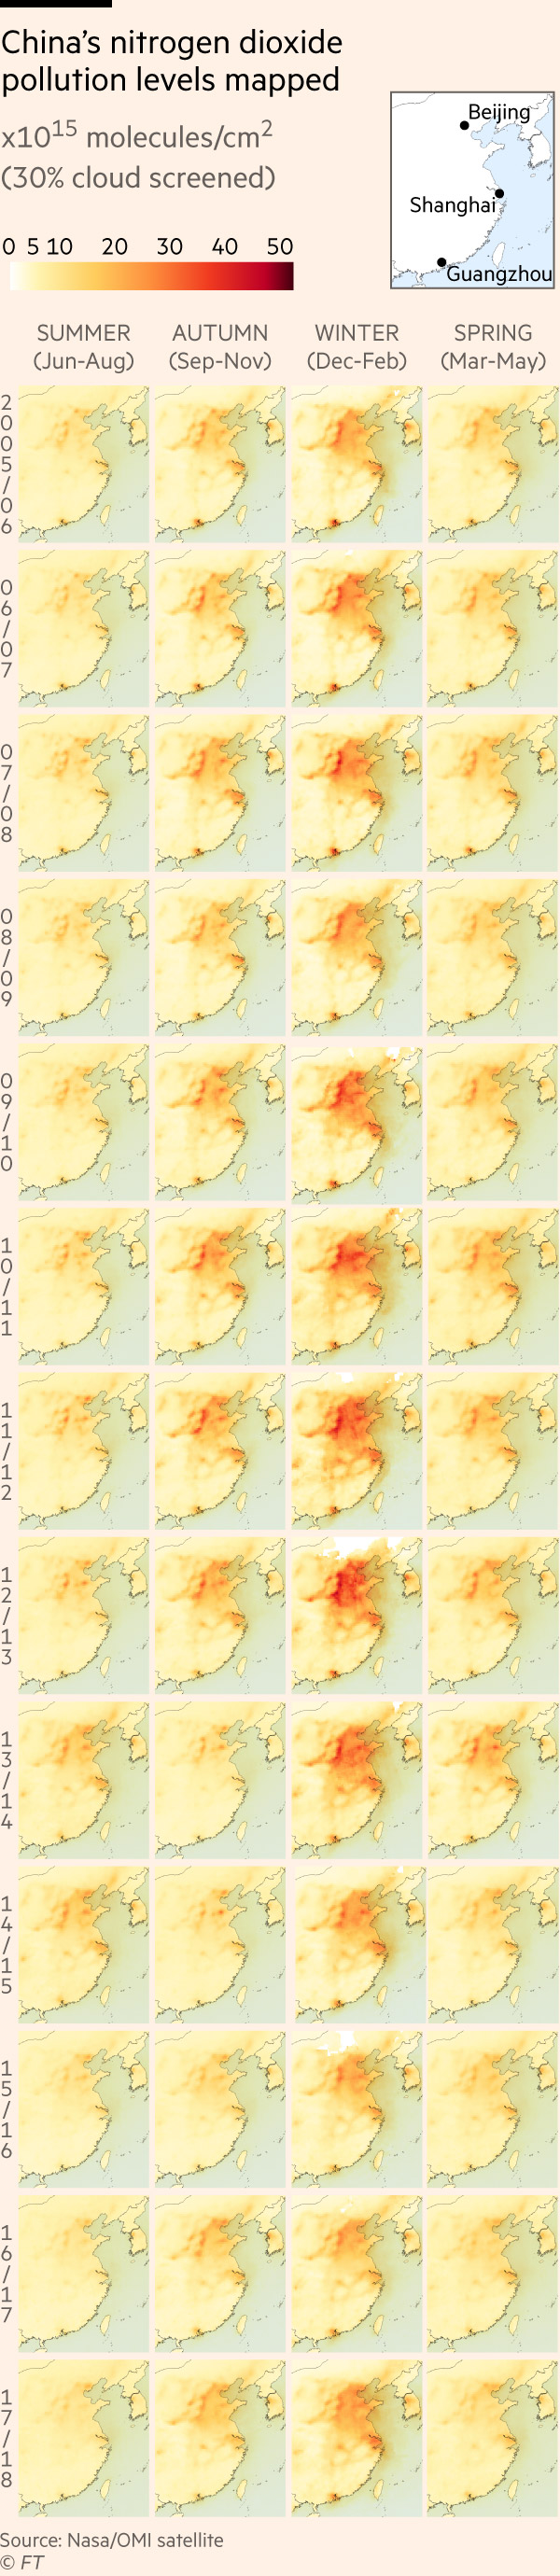
Or are they? The Financial Times has collated Nasa satellite data showing concentrations of nitrogen dioxide — a common air pollutant — over China from January 2005 to May 2018.
A time-lapse of the data reveals the extent of the pollution crisis, and how pollution spikes in winter, when coal is required for heating. But it also reveals a troubling resurgence in pollution levels.
One particularly noticeable phenomenon is how pollution across the north China plain abated from the summer of 2013 to the summer of 2016. Part of that may be due to improving pollution controls. But it also reflects a sharp dip in economic growth during that time. Pollution levels begin to climb again from the winter of 2016-17 as the economy recovered.
“The latest rise in coal consumption and CO2 emissions suggests that the country’s ‘new normal’ economic cycle, which started from 2012, has touched the bottom and has began to enter a cycle of recovery,” said Zou Ji, president of Energy Foundation China.
Still, some demand has shifted from heavy industrial users to household power consumers, so even a return in pollution may not mean levels as bad as in the past, Mr Zou said.
The worst periods by far were during the winter of 2012-13. Those years were the high point of a stimulus campaign by Beijing to bolster the economy in the wake of the global financial crisis of 2008. Spikes of NO2 from coal-burning plants in Shanxi and along the western edge of the north China plain in Hebei province contributed to huge plumes of pollution across central and eastern China.
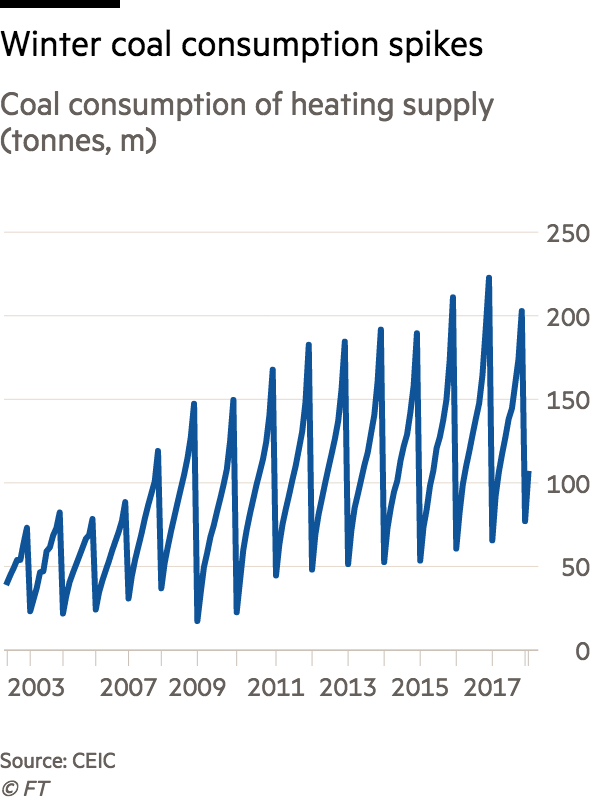
Regulators are attempting to offset winter pollution spikes by shifting production of metals such as steel, and transport of coal — both the production and transport contribute to pollution — away from the winter months. A botched attempt to convert to gas last autumn, and the introduction of official targets for removing industrial boilers and residential coal burners, left millions of poor Chinese without heat during the first weeks of winter. A public outcry forced authorities to relent.
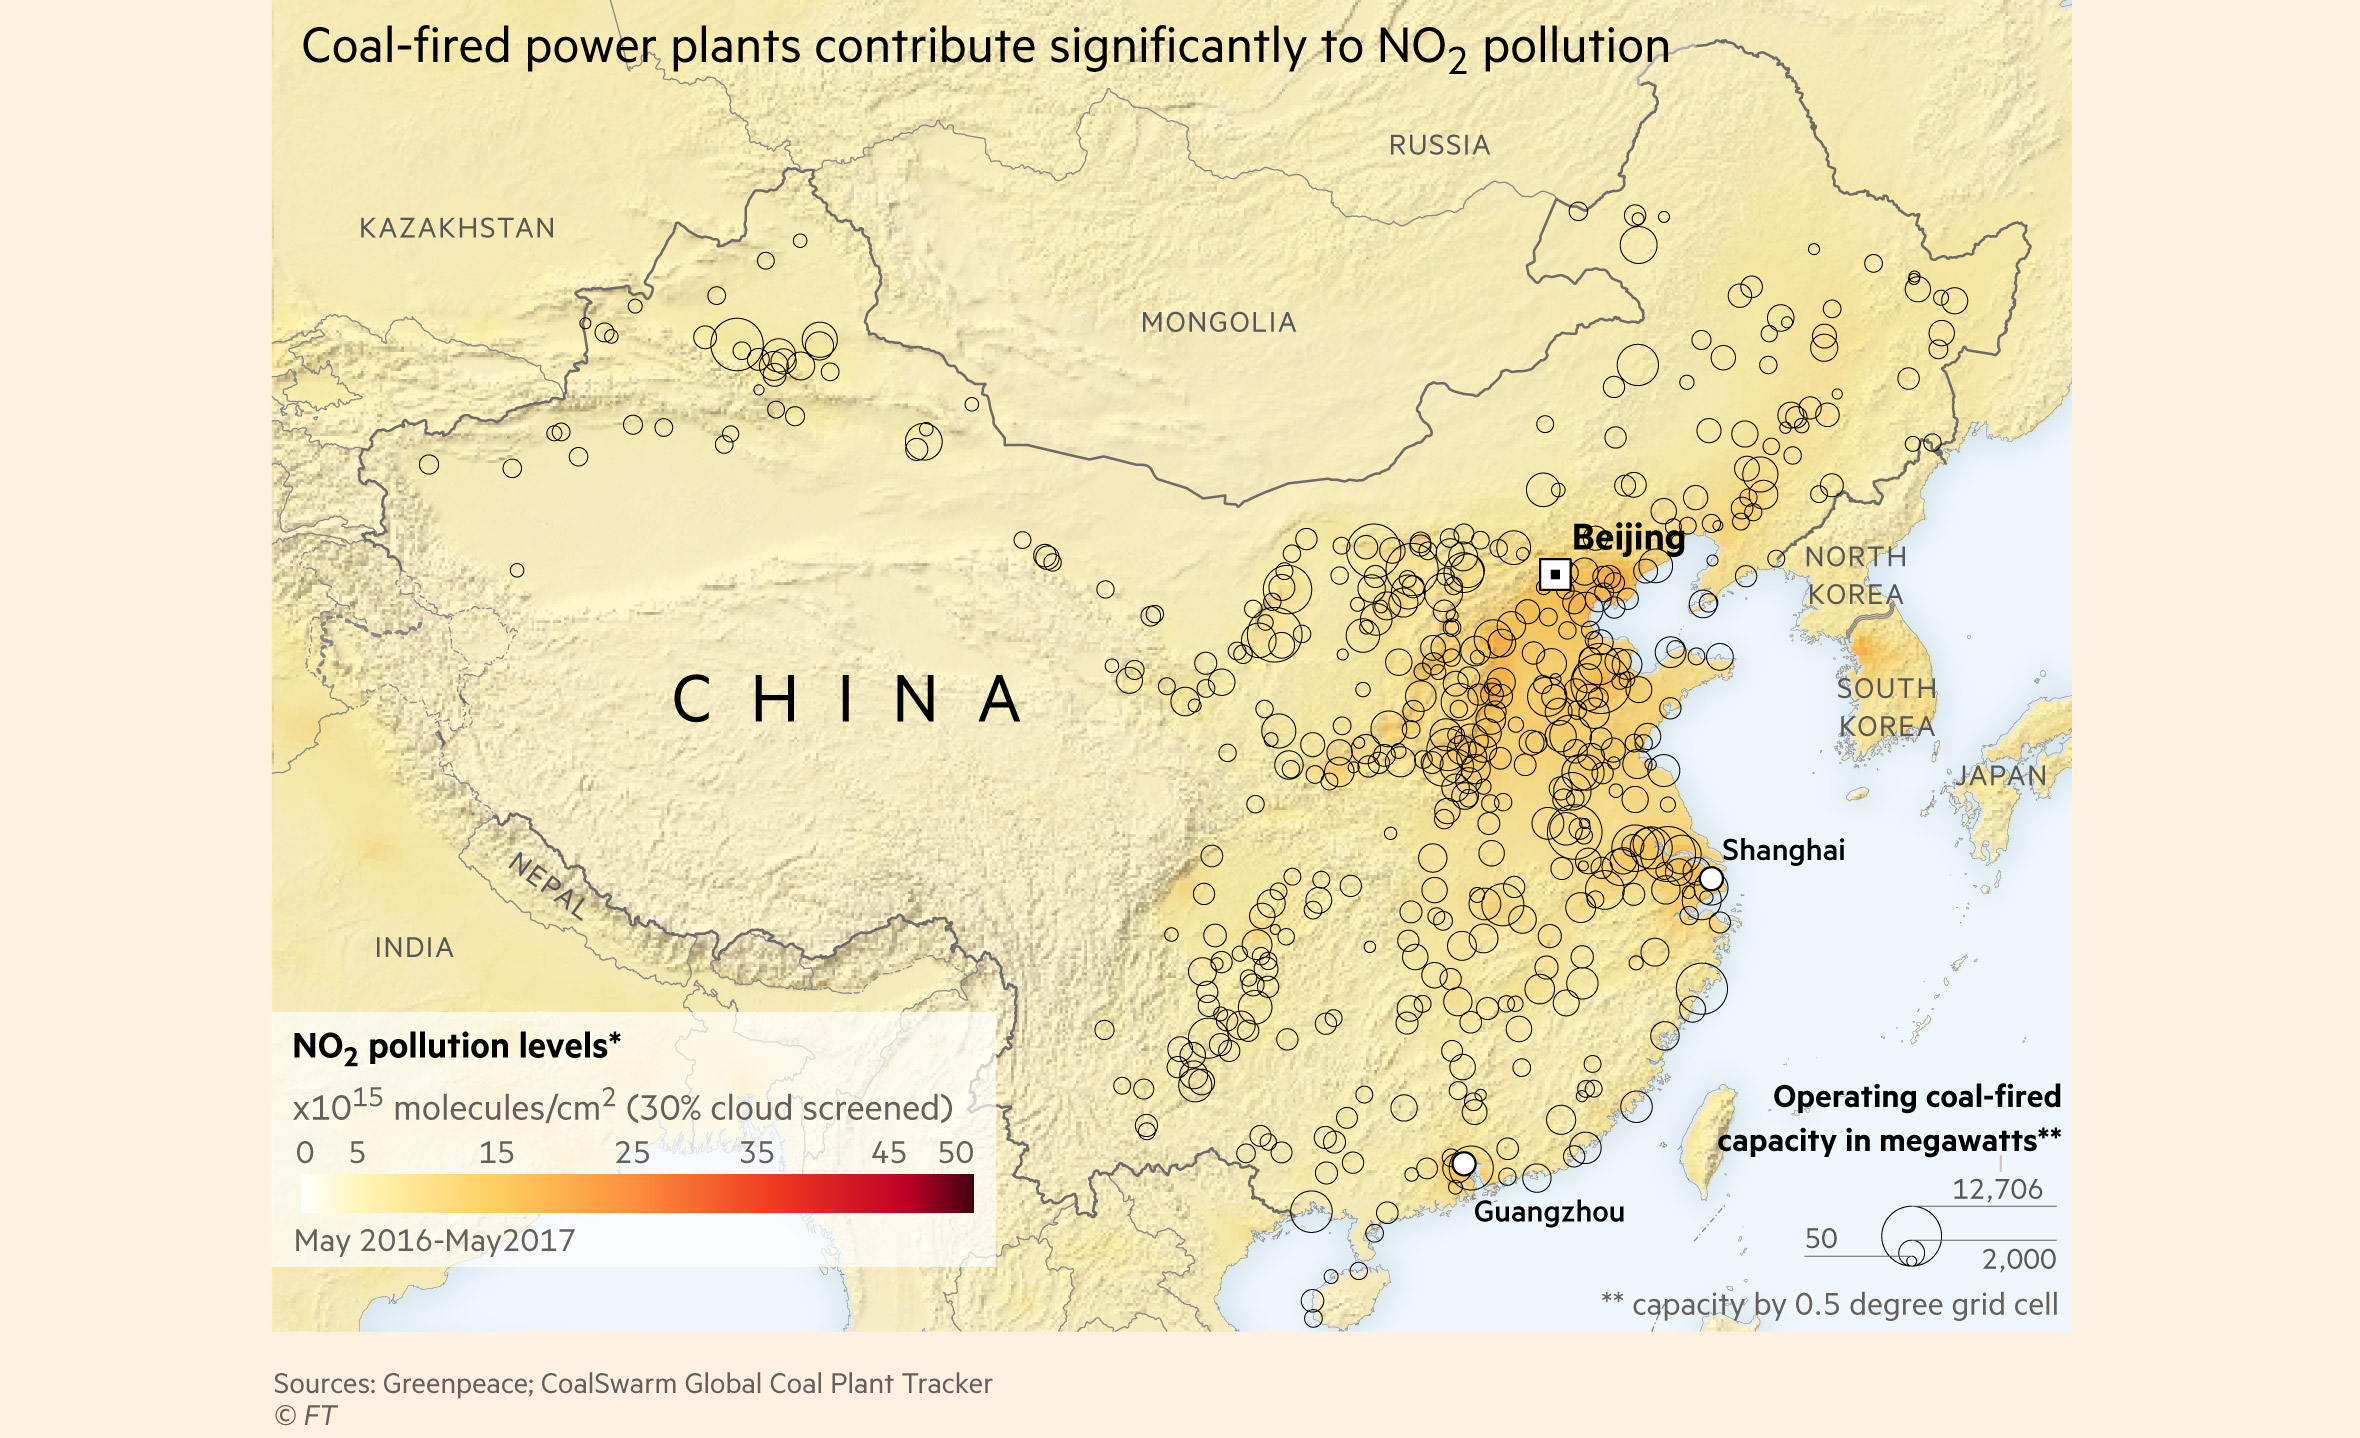
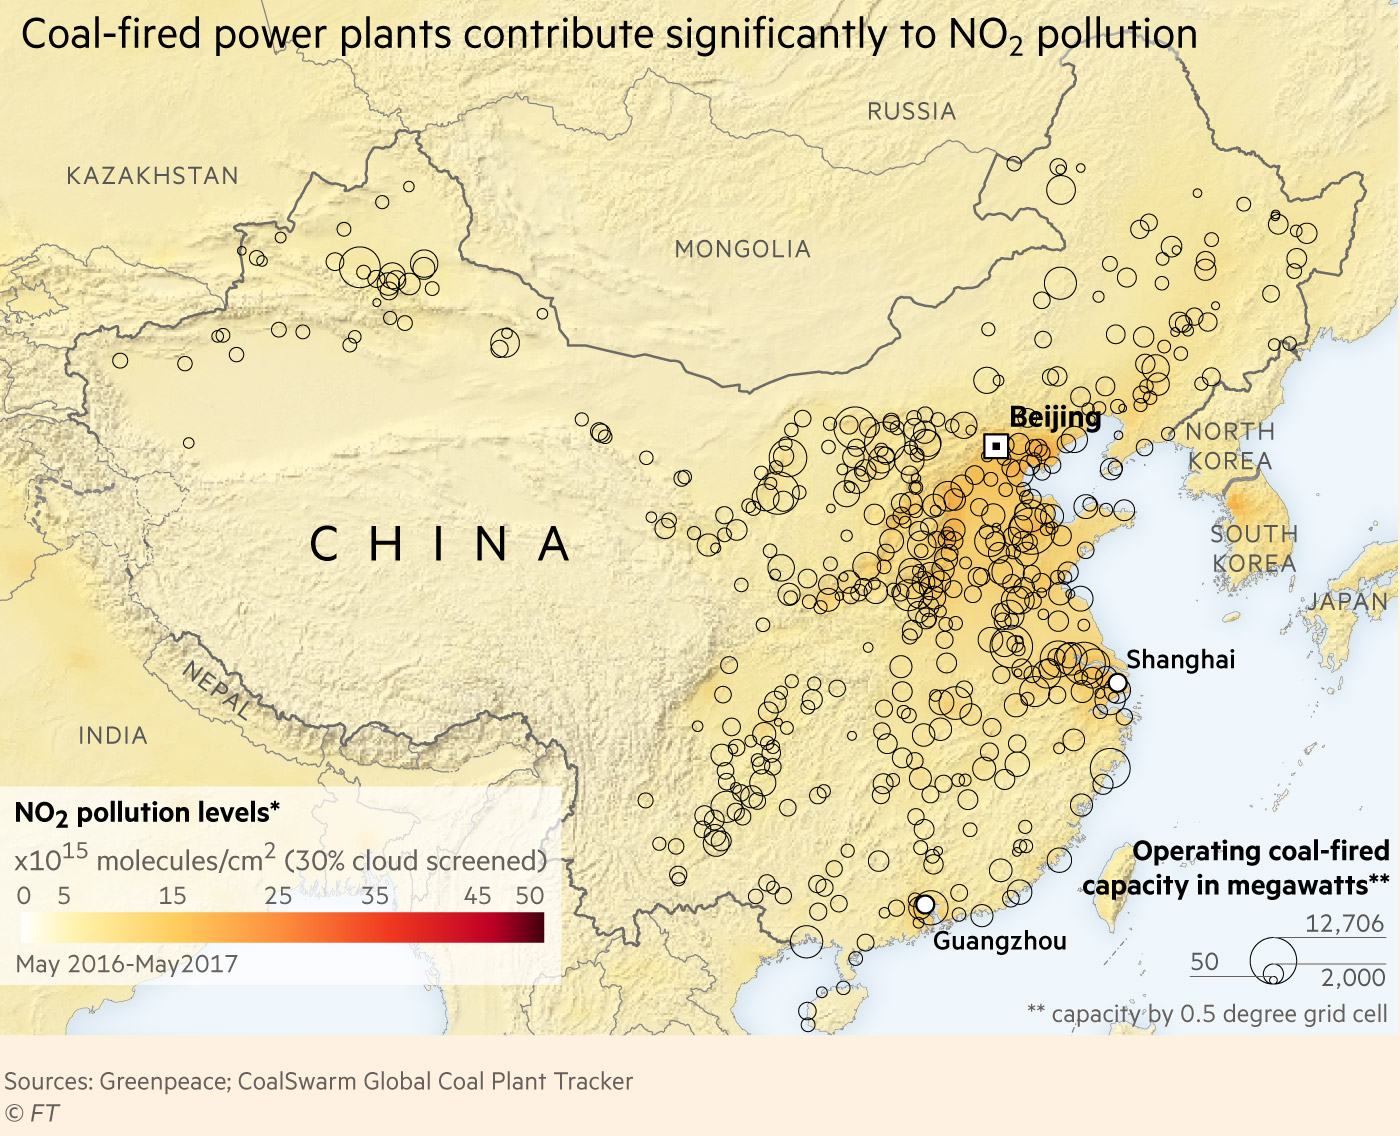
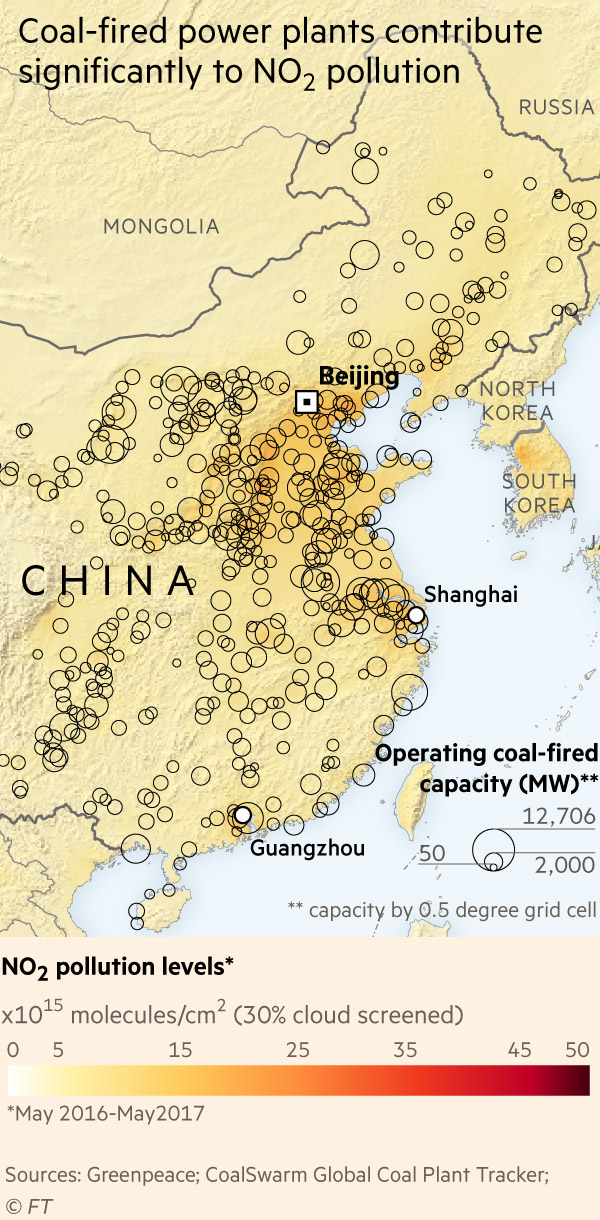
Burning coal or oil emits NO, which quickly combines with oxygen to form NO2. That can be more precisely detected because of its short lifespan, making it easier to pinpoint the sources of pollution. About 50 to 70 per cent of NO2 sources correspond to thermal power generation, heating and industrial boilers — all of which are concentrated in the hyper-polluted north China plain. About one-fifth derive from transport.
By contrast, measures of PM2.5, or tiny particulates in the air, are a popular way for the public to track pollution levels. However, PM2.5 measurements can be influenced by other factors, such as sand storms. The particles tend to linger in the air longer, making it harder to form a clear picture of what the pollution sources are.
The map below shows the correlation between power plants and NO2 emissions.
The lull in industrial activity from 2013-16 accompanied stricter enforcement of emissions regulations in China. If those measures can be maintained even as the economy ramps up again, China may be able to avoid revisiting the worst “smogocalypse” events of the past. The two maps below show the fall in NO2 concentration from its 2013 peak to the past 12 months, as well as the rise over the past 12 months compared with the year before.
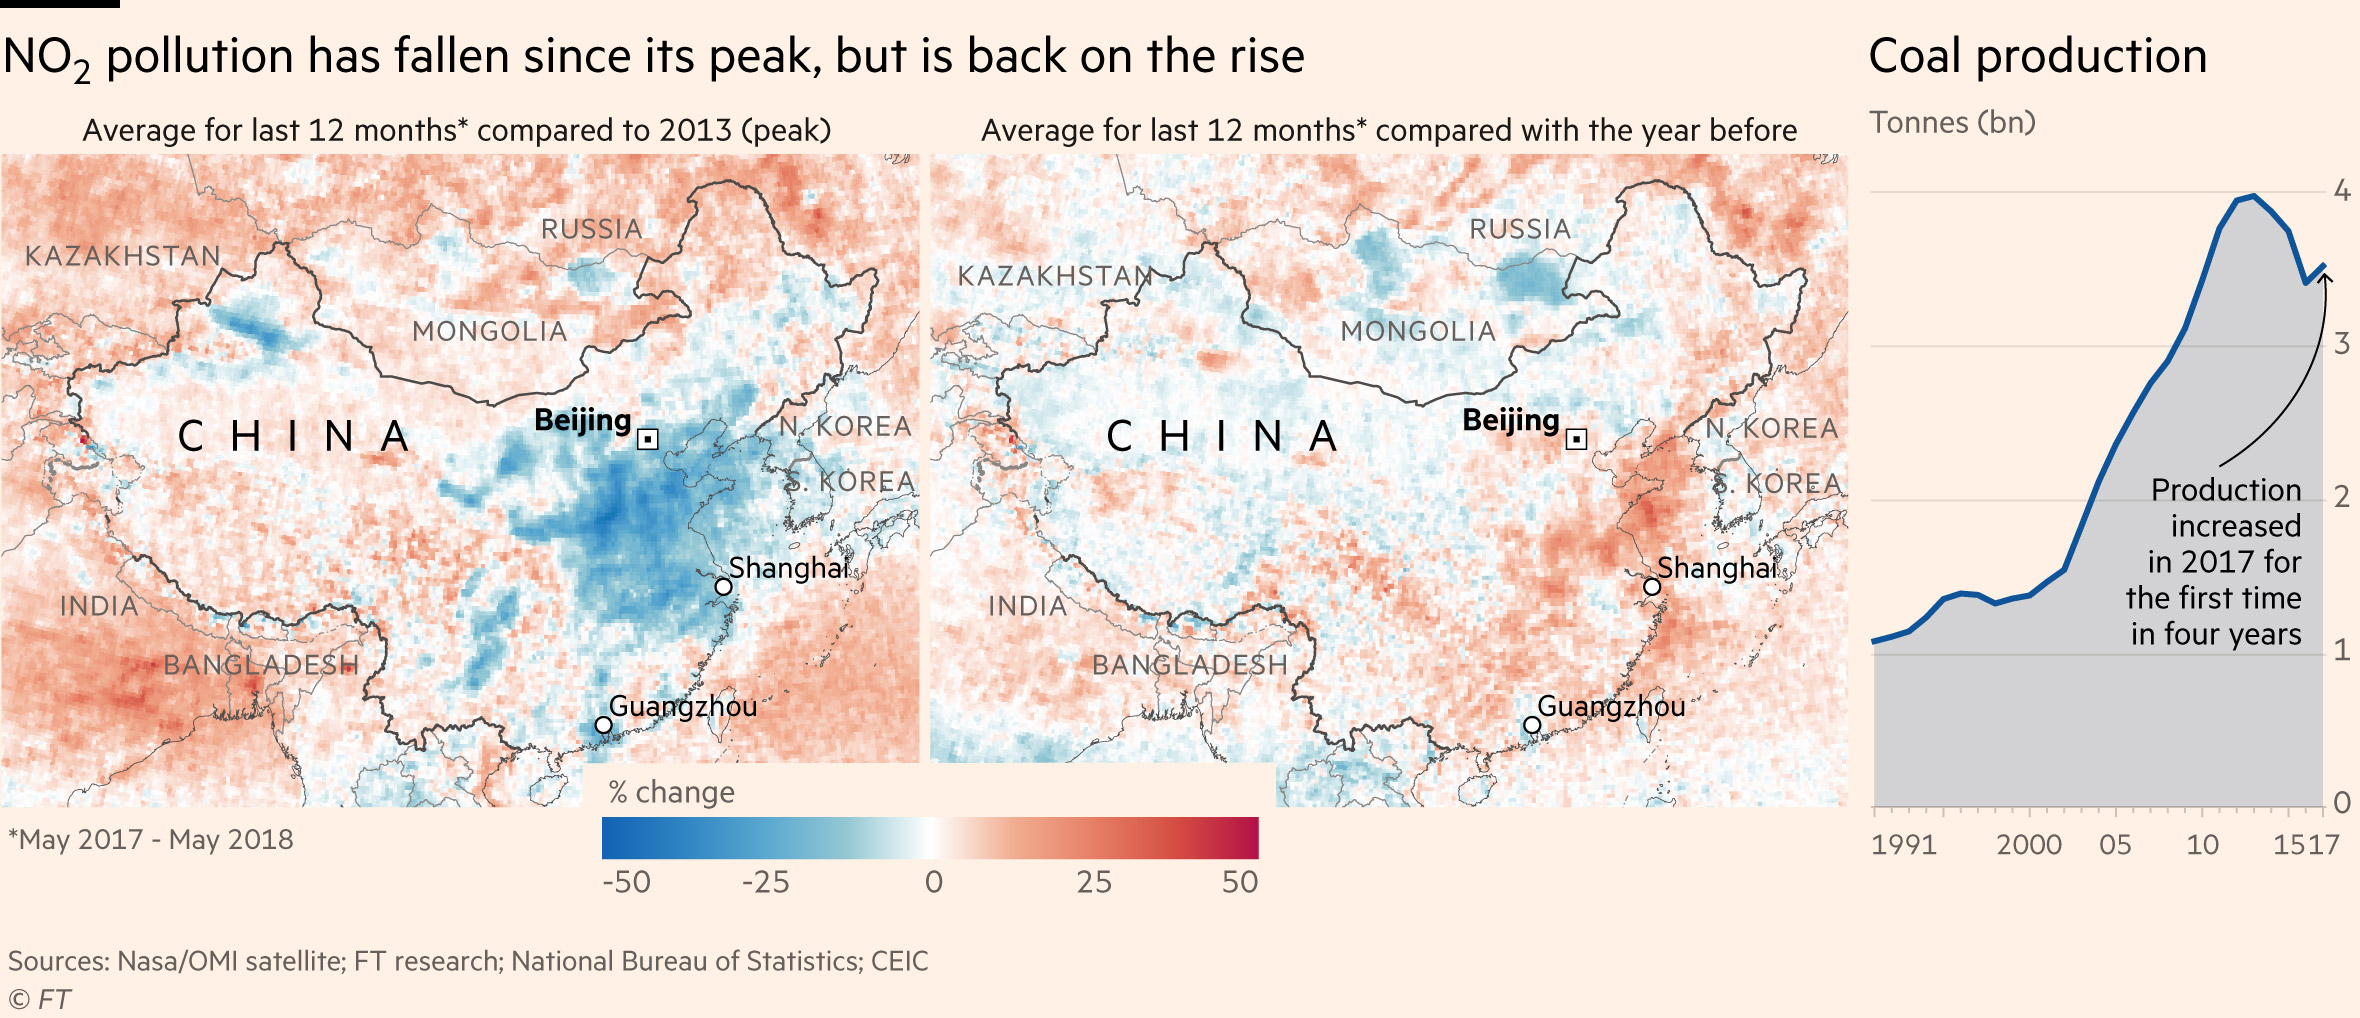
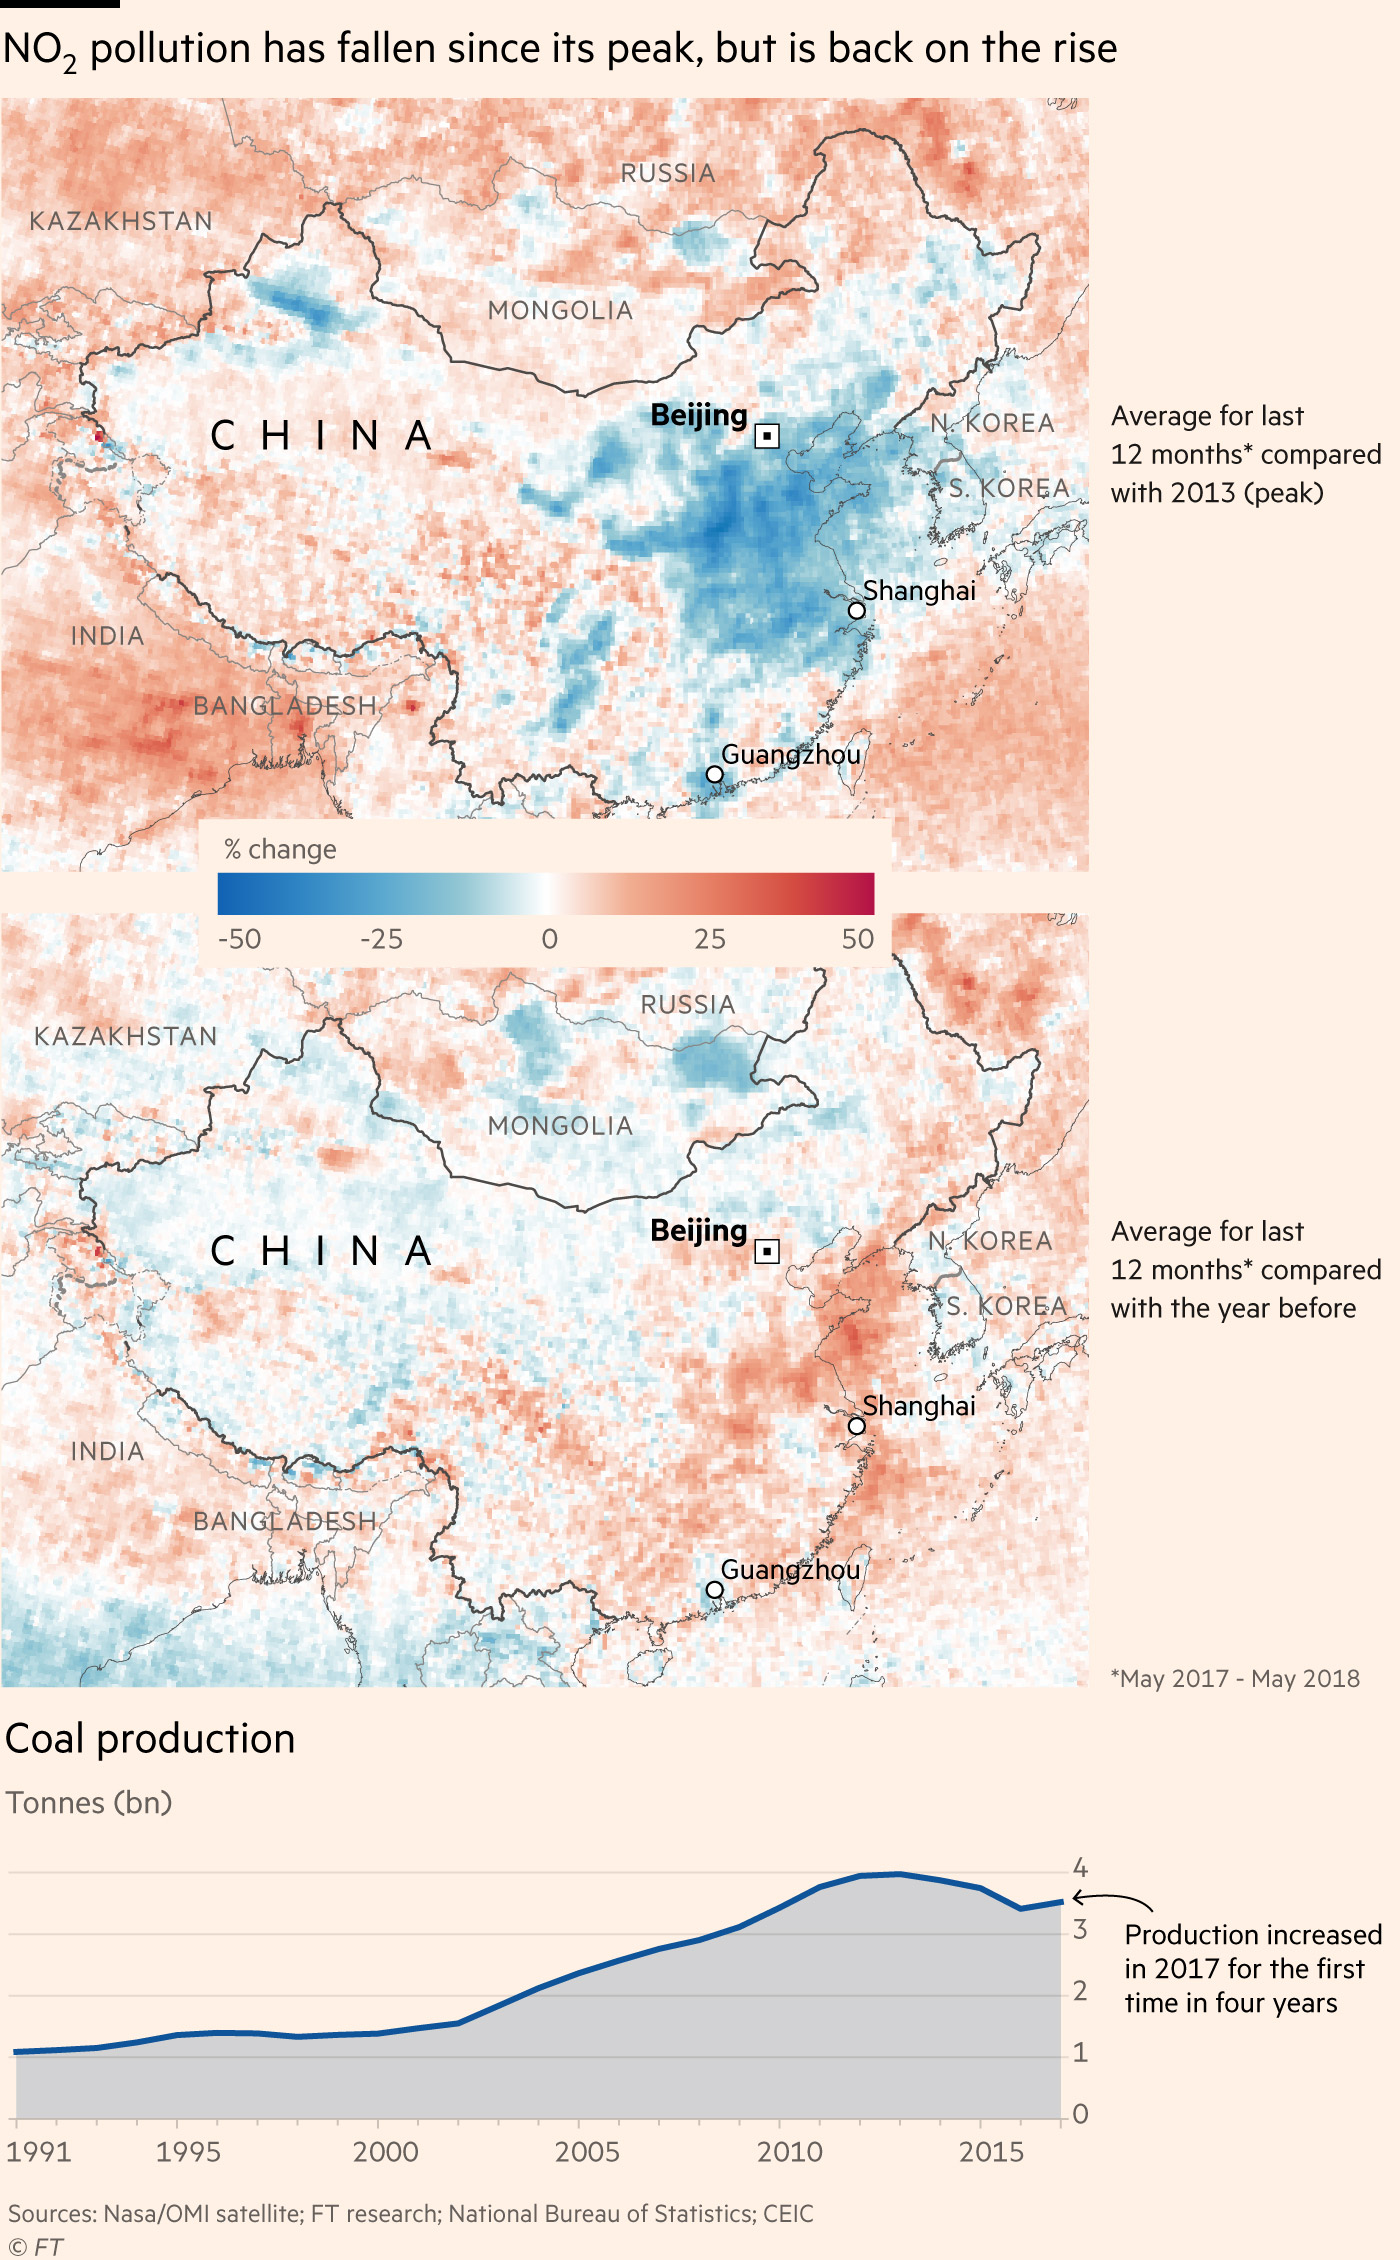
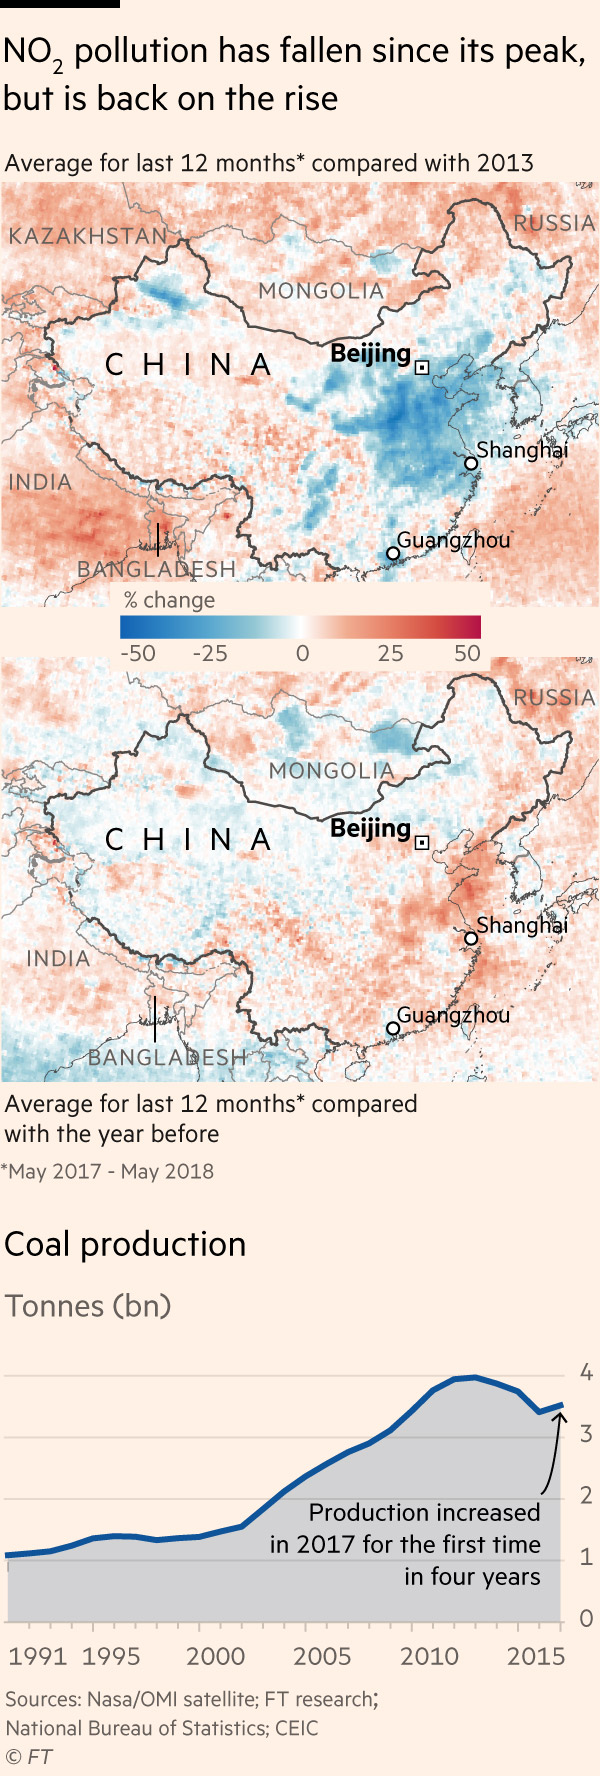
Look carefully, and you can also see new nodes of pollution forming, including, at the lower left of the two maps — rising emissions in Bangladesh and along northern India’s industrialised Ganges plain. Northern India’s pollution rose steeply during the years pollution in China abated, and kept rising even as Chinese pollution returned in the past 18 months.
It is no coincidence that smog, a sore topic in China for many years, became a hot topic in India this winter.