The repo blow-up of 2019 set markets on edge and prompted the Fed to pump billions of dollars of emergency funding into the financial system. Here, we break down what went wrong, what happens next, and whether markets can avoid another cash crunch.
The overnight repo rate spiked in September
Overnight repo rate (%)
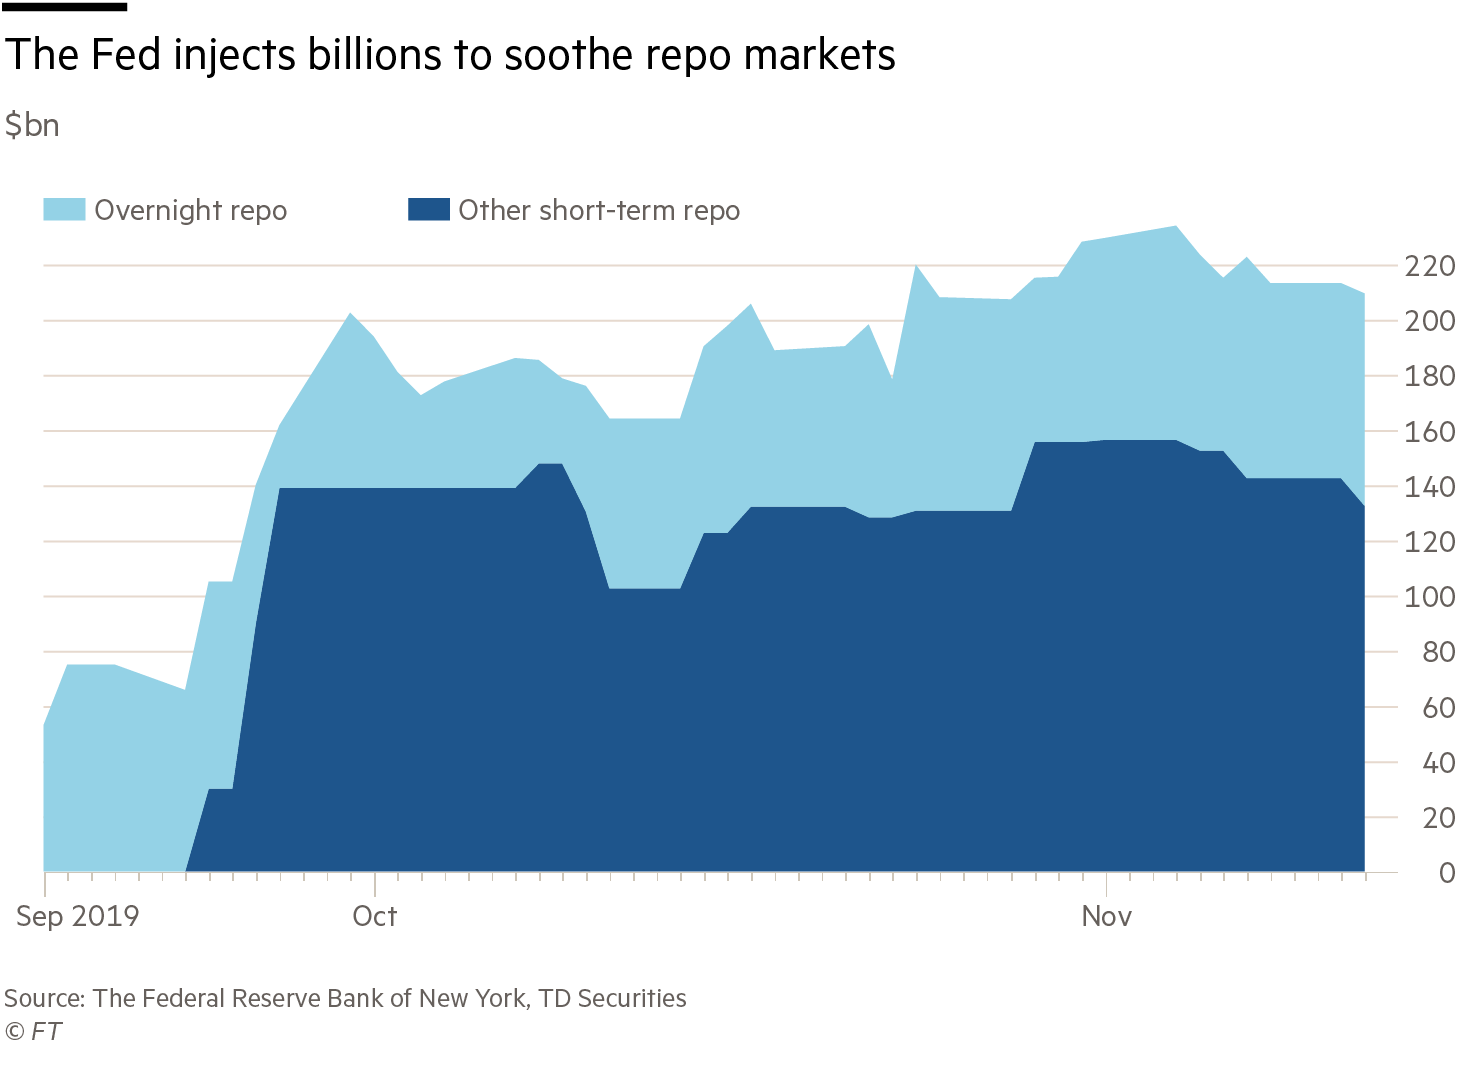
The overnight “repo” market, where banks lend cash to other institutions in exchange for collateral like US government debt, has been calmer since, but the test of the central bank’s intervention will come at year end, when money is typically in short supply. As well as daily cash injections, the Fed is expanding its balance sheet again.
Some banks used the scare to argue post-crisis rules had hurt liquidity, prompting a rebuke from Senator Elizabeth Warren and other supporters of tough regulation. The Fed has focused on a series of technical factors that built up over years and drove demand for cash in the repo market to exceed supply. The driving forces described below are informed by dozens of conversations with bankers, analysts, investors and policymakers.
Rising demand for cash is represented by the showing overnight repo trading volume. Scroll through the charts below to see how events extending back more than two years crimped the supply of cash and helped push the repo market to breaking point.
Demand for cash
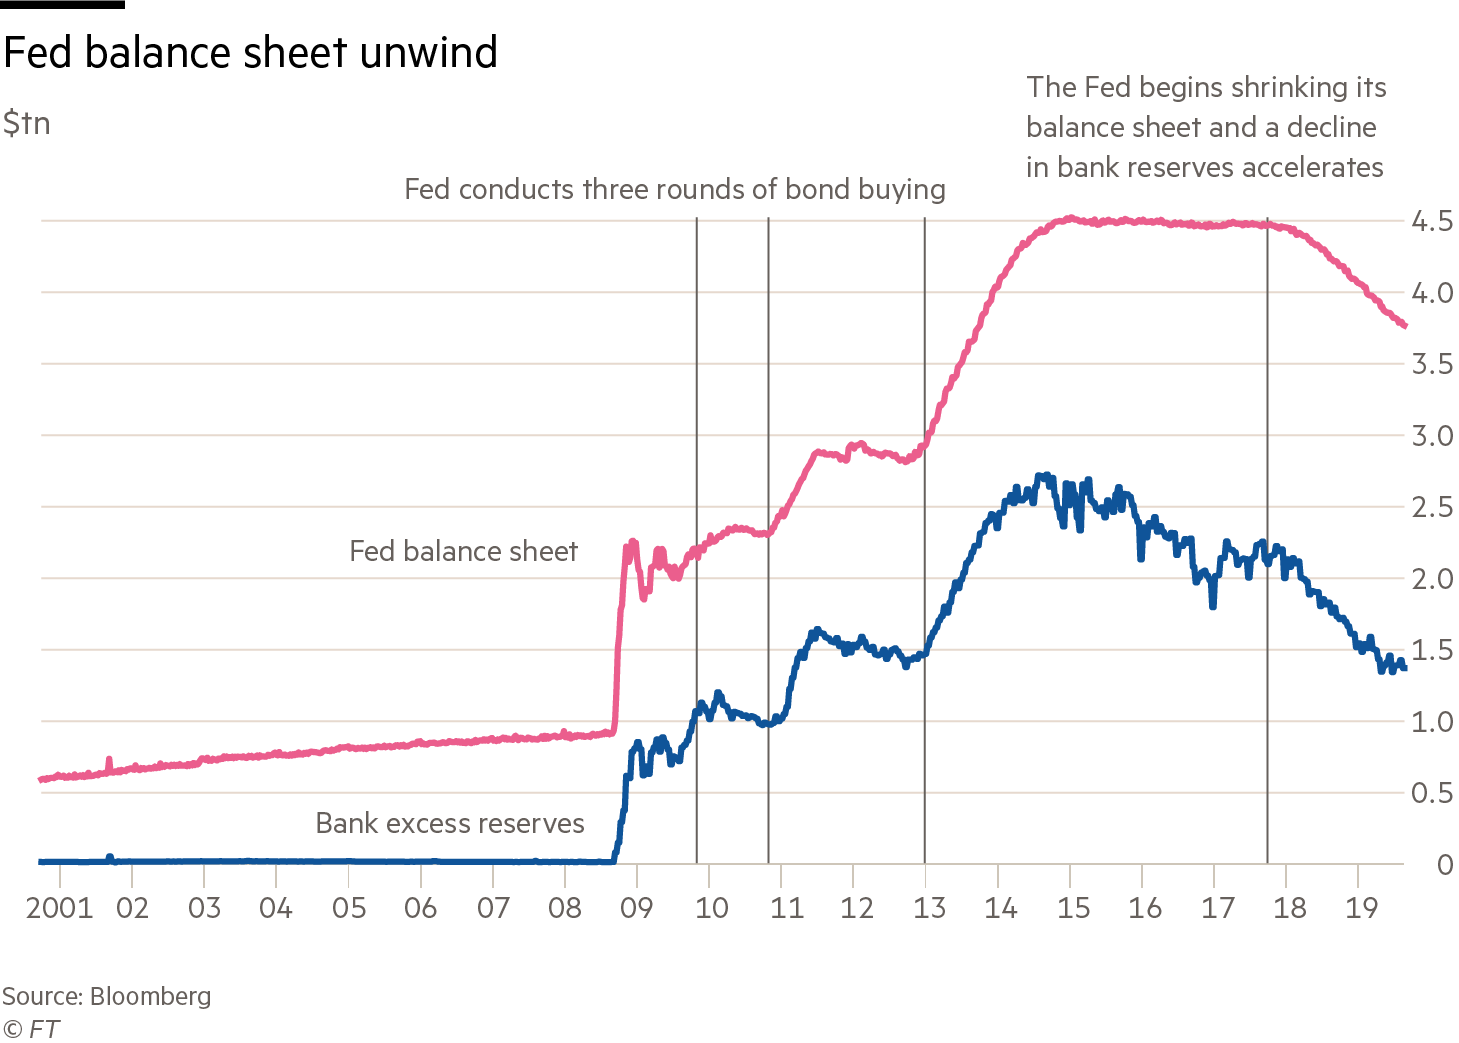
The Federal Reserve bought trillions of dollars of US government debt to prop up the economy after the financial crisis. It began unwinding that intervention two years ago, taking one of the biggest buyers of Treasuries out of the market.
New buyers had to step in to replace the Fed. These were often banks using their own cash or other investors withdrawing cash from banks to fund the purchases. In both cases, the result was to reduce the cash reserves banks held and therefore to reduce the amount available for overnight lending.
Some buyers used the repo market to fund their purchases, increasing demand just as supply was coming down.
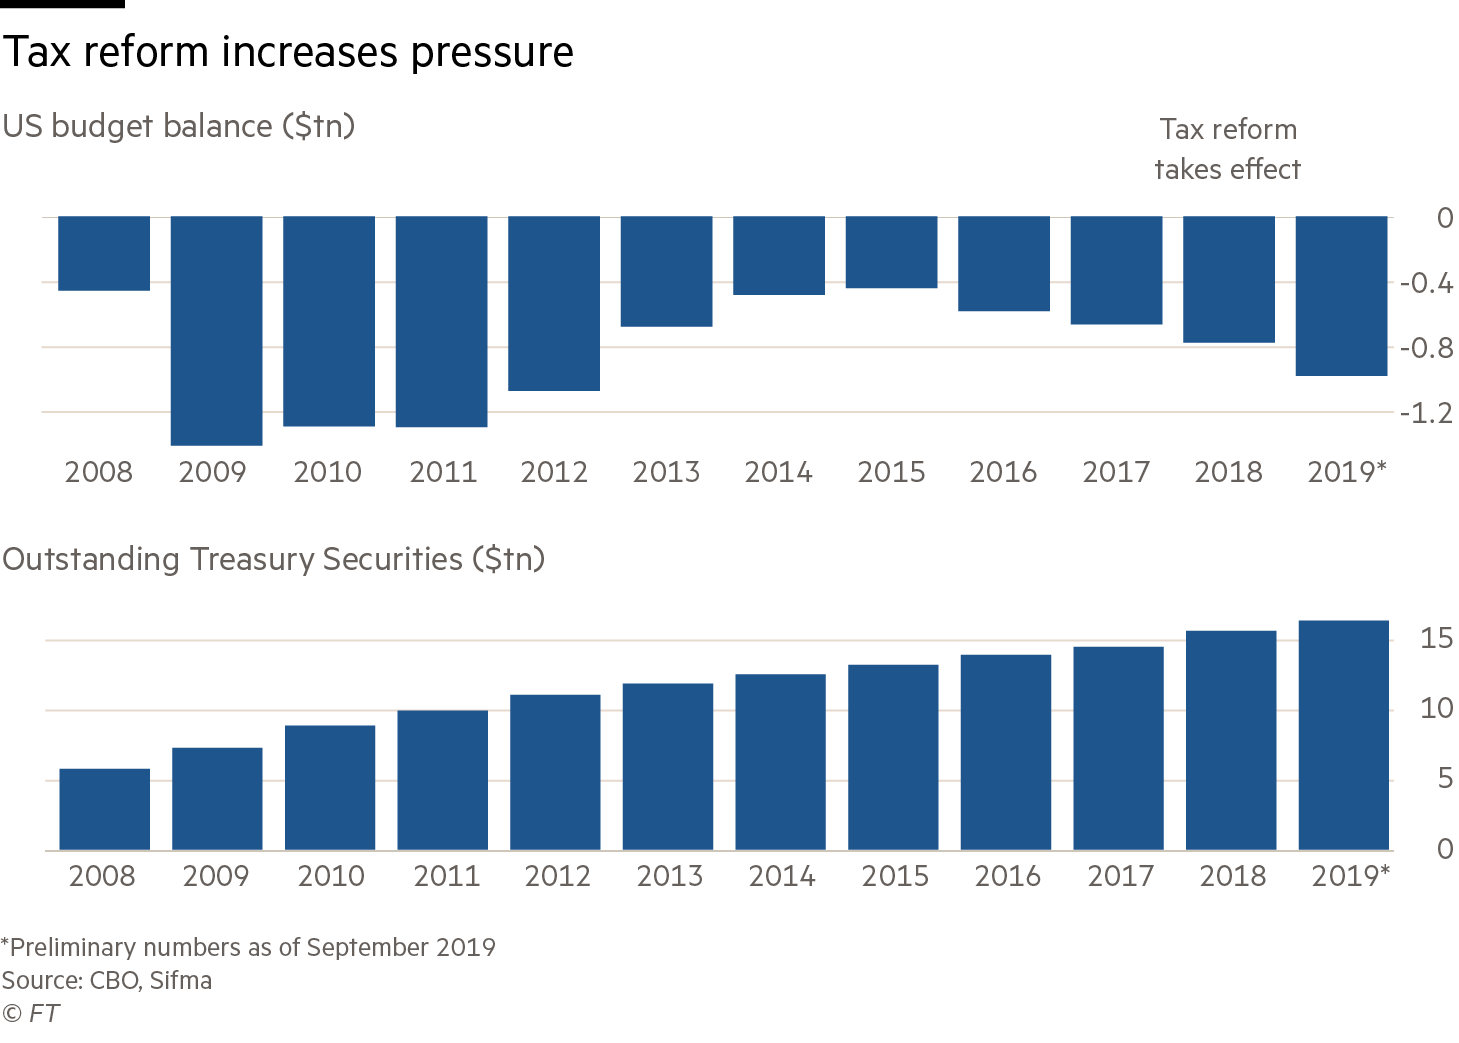
The Trump administration lowered the corporate tax rate, which meant lower tax income for the US government and a bigger budget deficit. The US Treasury funded that by selling more debt, which the banks and other investors bought. Once again, since cash was going to buy government bonds, there was less available to lend in overnight markets.
The tax reform also gave US corporations a one-off opportunity to cheaply bring back cash held overseas. Before this, multinationals like Microsoft and Google kept foreign earnings offshore, often invested in US government debt. Companies brought $777bn home in 2018 and so stopped buying as many Treasuries, again increasing the amount that needed to be bought by other investors.
The first signs of pressure began to emerge in another short-term lending market. The fed funds rate — which reflects unsecured borrowing between banks, unlike repo where borrowing is secured using collateral — was drifting towards the top of the range set by the Federal Reserve. That worried central bankers, since fed funds is the rate they target to guide the US economy. They could not afford to lose control of it.
The Fed responded by cutting the interest it pays banks on excess reserves, in the hope banks would lend more to each other instead.
As bank reserves fell, the fed funds rate bust through what markets thought was a cap
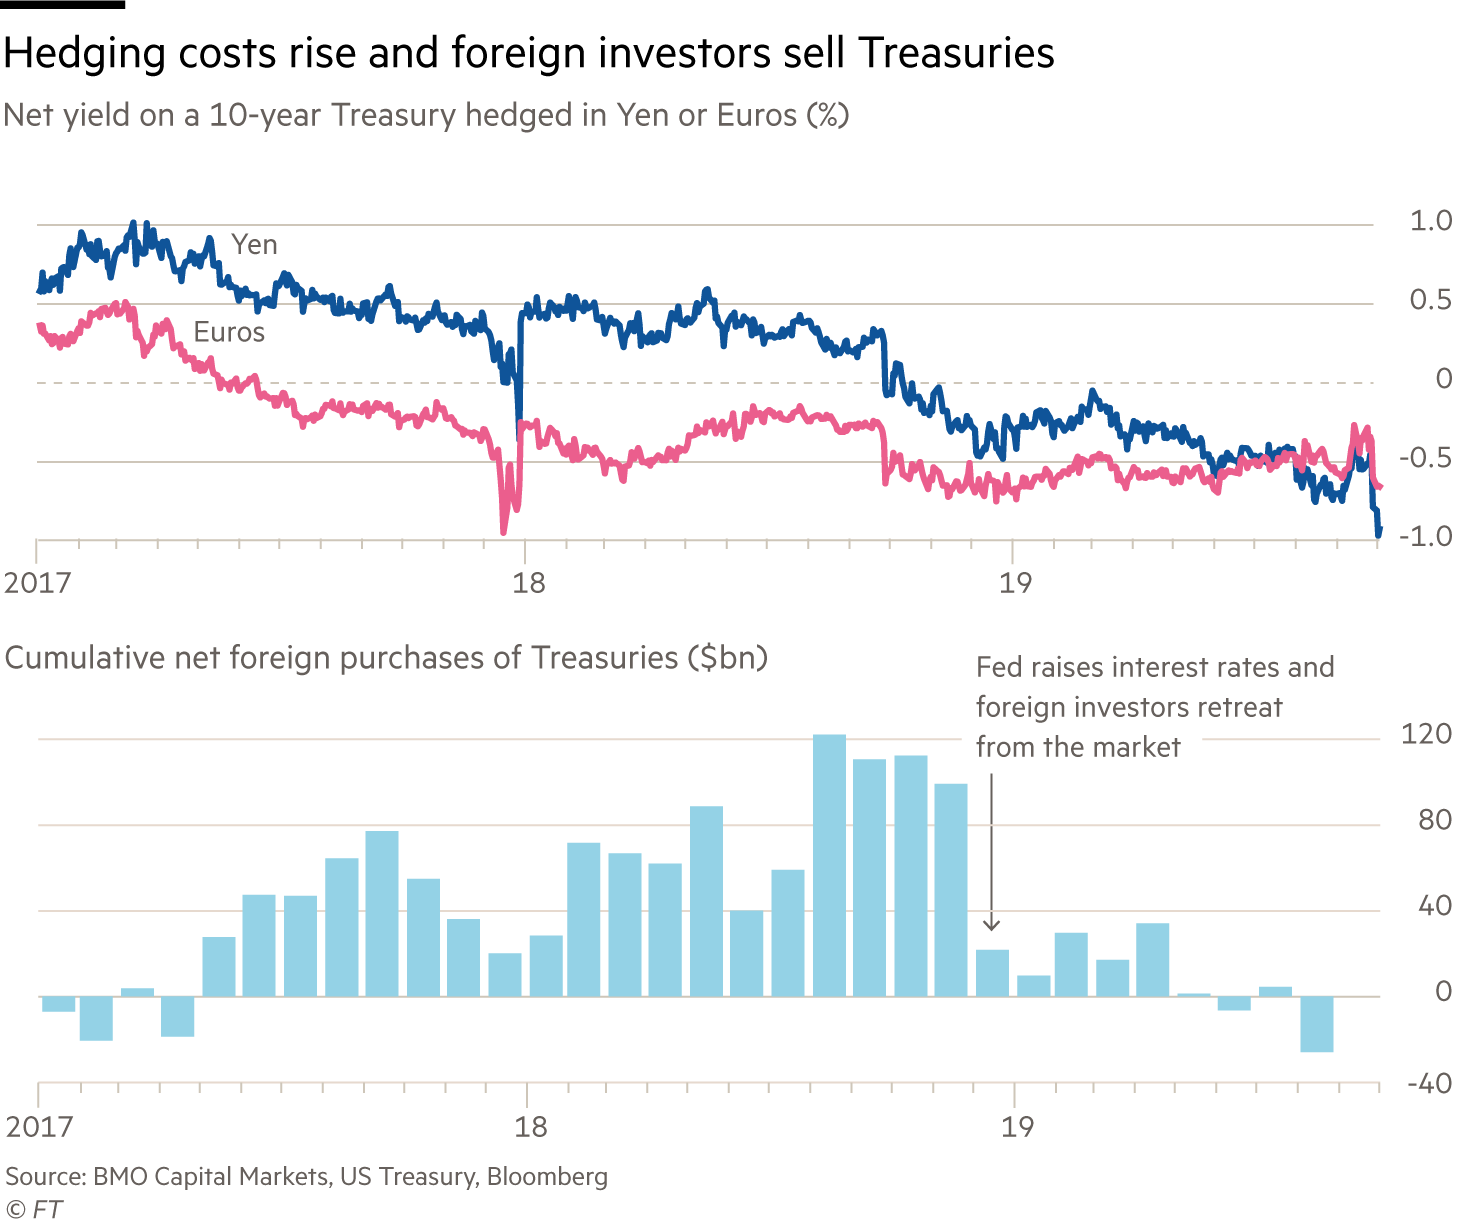
The Fed raised rates for the fourth time that year, despite fears of slowing global growth. Some foreign investors hedge their Treasury purchases by converting the dollar investment back into their local currency but the cost of doing that goes up when a hawkish Fed is pushing up short-term rates. After the rate hike foreign buying of Treasuries quickly dropped off, yet again forcing domestic banks and investors to step in and further draining the cash available for repo lending.
An escalating trade war compounded concerns over global growth. The yield on the benchmark 10-year Treasury fell below the yield on shorter-dated government debt , in what many investors viewed as a signal of impending recession. This discouraged some investors from buying longer-dated Treasuries, pushing banks to step in instead and further reducing their reserves.
However, some analysts contend it also encouraged investors to put their cash into short-term lending markets, cancelling out any effect on repo.
How the yield curve inverted
Daily US Treasury yields with 3 month and 10 year yields highlighted (%)
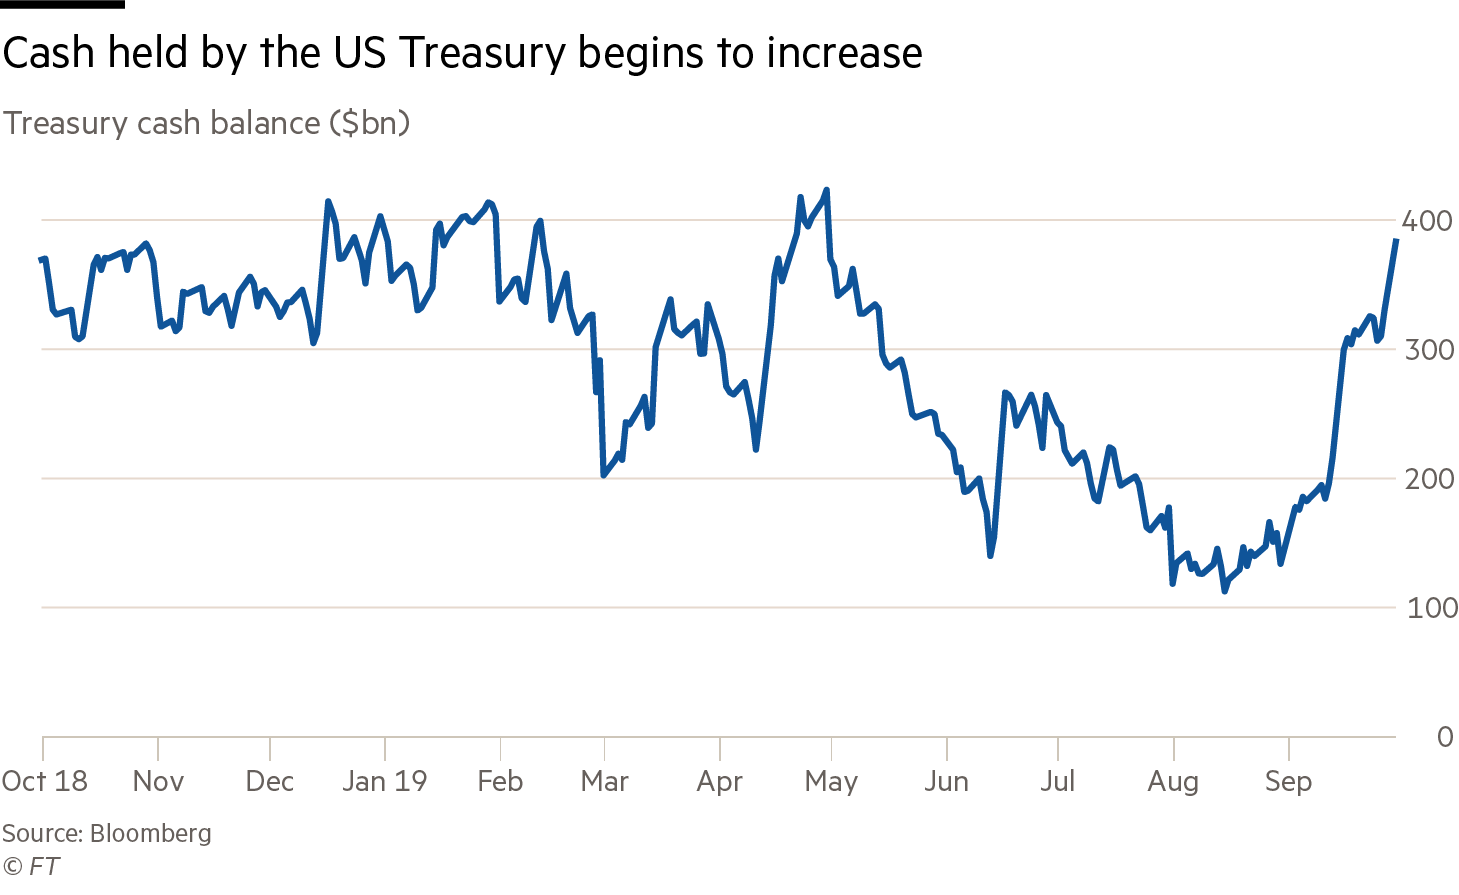
Congress agreed to lift a ceiling on the US national debt for two years and the US Treasury was able to borrow more, issuing additional Treasuries whose purchases again used up cash previously available for repo. The Treasury very quickly rebuilt its depleted cash balance, as the fresh cash from new debt sales came alongside the regular surge in corporate tax payments in September.
Money sitting with the US Treasury is money that is not circulating in the financial system through the banks. As the Treasury filled its coffers, the repo market finally tipped over the edge.
The spike in the repo rate to almost 10 per cent took traders and policymakers by surprise partly because banks held a cumulative $1.2tn in cash reserves at the Fed. The ability to earn a higher rate of interest in the repo market should have coaxed banks to lend this cash, but they did not.
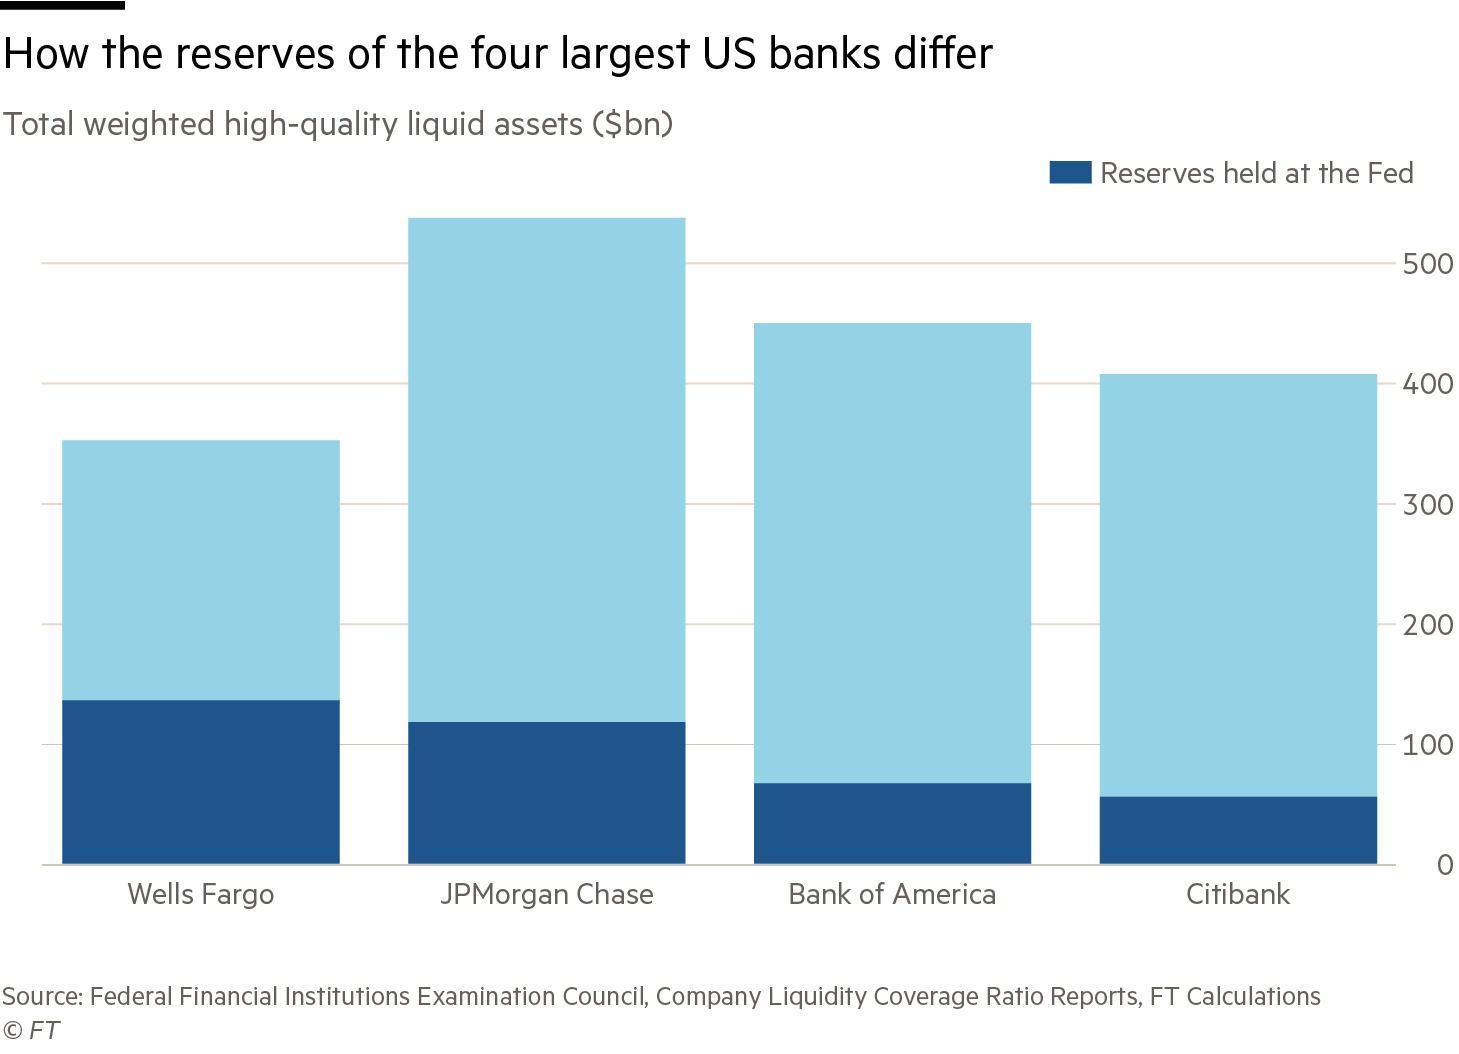
Some bankers said they were prevented from lending more in the repo market by post-financial crisis requirements to keep minimum levels of cash on hand. Reserves are concentrated in the largest banks, which have to keep a level of high-quality, liquid assets on their balance sheets — reserves at the Fed are the most liquid, highest-quality asset there is.
But apart from regulation, different banks also seem to have different internal policies on the level of reserves they keep — Wells for example, keeps 39 per cent of its highest quality assets in reserves, while Bank of America and Citibank keep only about 15 per cent each.
The Federal Reserve responded to the turmoil by instructing its New York branch to lend billions of its own dollars into the repo market. These operations are ongoing, having been both widened in scope, to include two-week lending as well as overnight repo, and increased in size.
The Fed is also buying Treasuries again, expanding its balance sheet by an extra $60bn a month in a bid to build up banks’ reserves and increase the amount of cash in the financial system more permanently. Chairman Jay Powell rejected the idea of easing banks’ capital or liquidity regulations but suggested other innovations such as “daylight overdrafts” for banks from the Fed.
The next hurdle is year end, when banks typically step back from the repo market so that their balance sheets are smaller for December 31 regulatory calculations. Demand for overnight repo appears to have steadied, with daily trading volume in the $1.05tn range, Traders think the New York Fed could expand supply further if there is any sign of stress. The Fed hopes it has already set the market right.
